
Gone are the days of ‘basic’ AI abilities, like writing love letters, poems, and emails, or cracking a joke.ChatGPT’s newly introduced advanced ability can…
Read the full article at: nightmags.com
Gone are the days of ‘basic’ AI abilities, like writing love letters, poems, and emails, or cracking a joke.ChatGPT’s newly introduced advanced ability can…
Read the full article at: nightmags.com

Breaking a longstanding impasse in our understanding of olfaction, scientists at UC San Francisco (UCSF) have created the first molecular-level, 3D picture of how an odor molecule activates a human odorant receptor, a crucial step in deciphering the sense of smell.
The findings, appearing online March 15, 2023, in the journal Nature, are poised to reignite interest in the science of smell with implications for fragrances, food science, and beyond. Odorant receptors — proteins that bind odor molecules on the surface of olfactory cells — make up half of the largest, most diverse family of receptors in our bodies; A deeper understanding of them paves the way for new insights about a range of biological processes.
“This has been a huge goal in the field for some time,” said Aashish Manglik, MD, PhD, an associate professor of pharmaceutical chemistry and a senior author of the study. The dream, he said, is to map the interactions of thousands of scent molecules with hundreds of odorant receptors, so that a chemist could design a molecule and predict what it would smell like.
“But we haven’t been able to make this map because, without a picture, we don’t know how odor molecules react with their corresponding odor receptors,” Manglik said.
Read the full article at: www.ucsf.edu
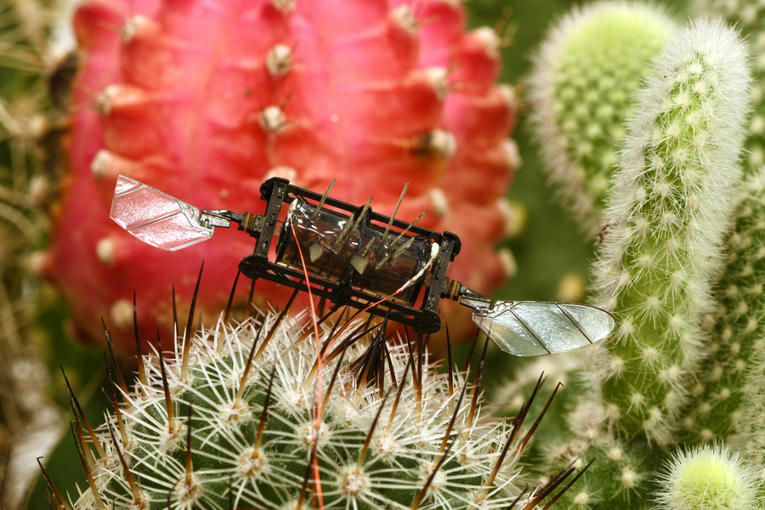
Bumblebees are clumsy fliers. It is estimated that a foraging bee bumps into a flower about once per second, which damages its wings over time. Yet despite having many tiny rips or holes in their wings, bumblebees can still fly.
Aerial robots, on the other hand, are not so resilient. Poke holes in the robot’s wing motors or chop off part of its propellor, and odds are pretty good it will be grounded.
Inspired by the hardiness of bumblebees, MIT researchers have developed repair techniques that enable a bug-sized aerial robot to sustain severe damage to the actuators, or artificial muscles, that power its wings — but to still fly effectively.
Read the full article at: news.mit.edu
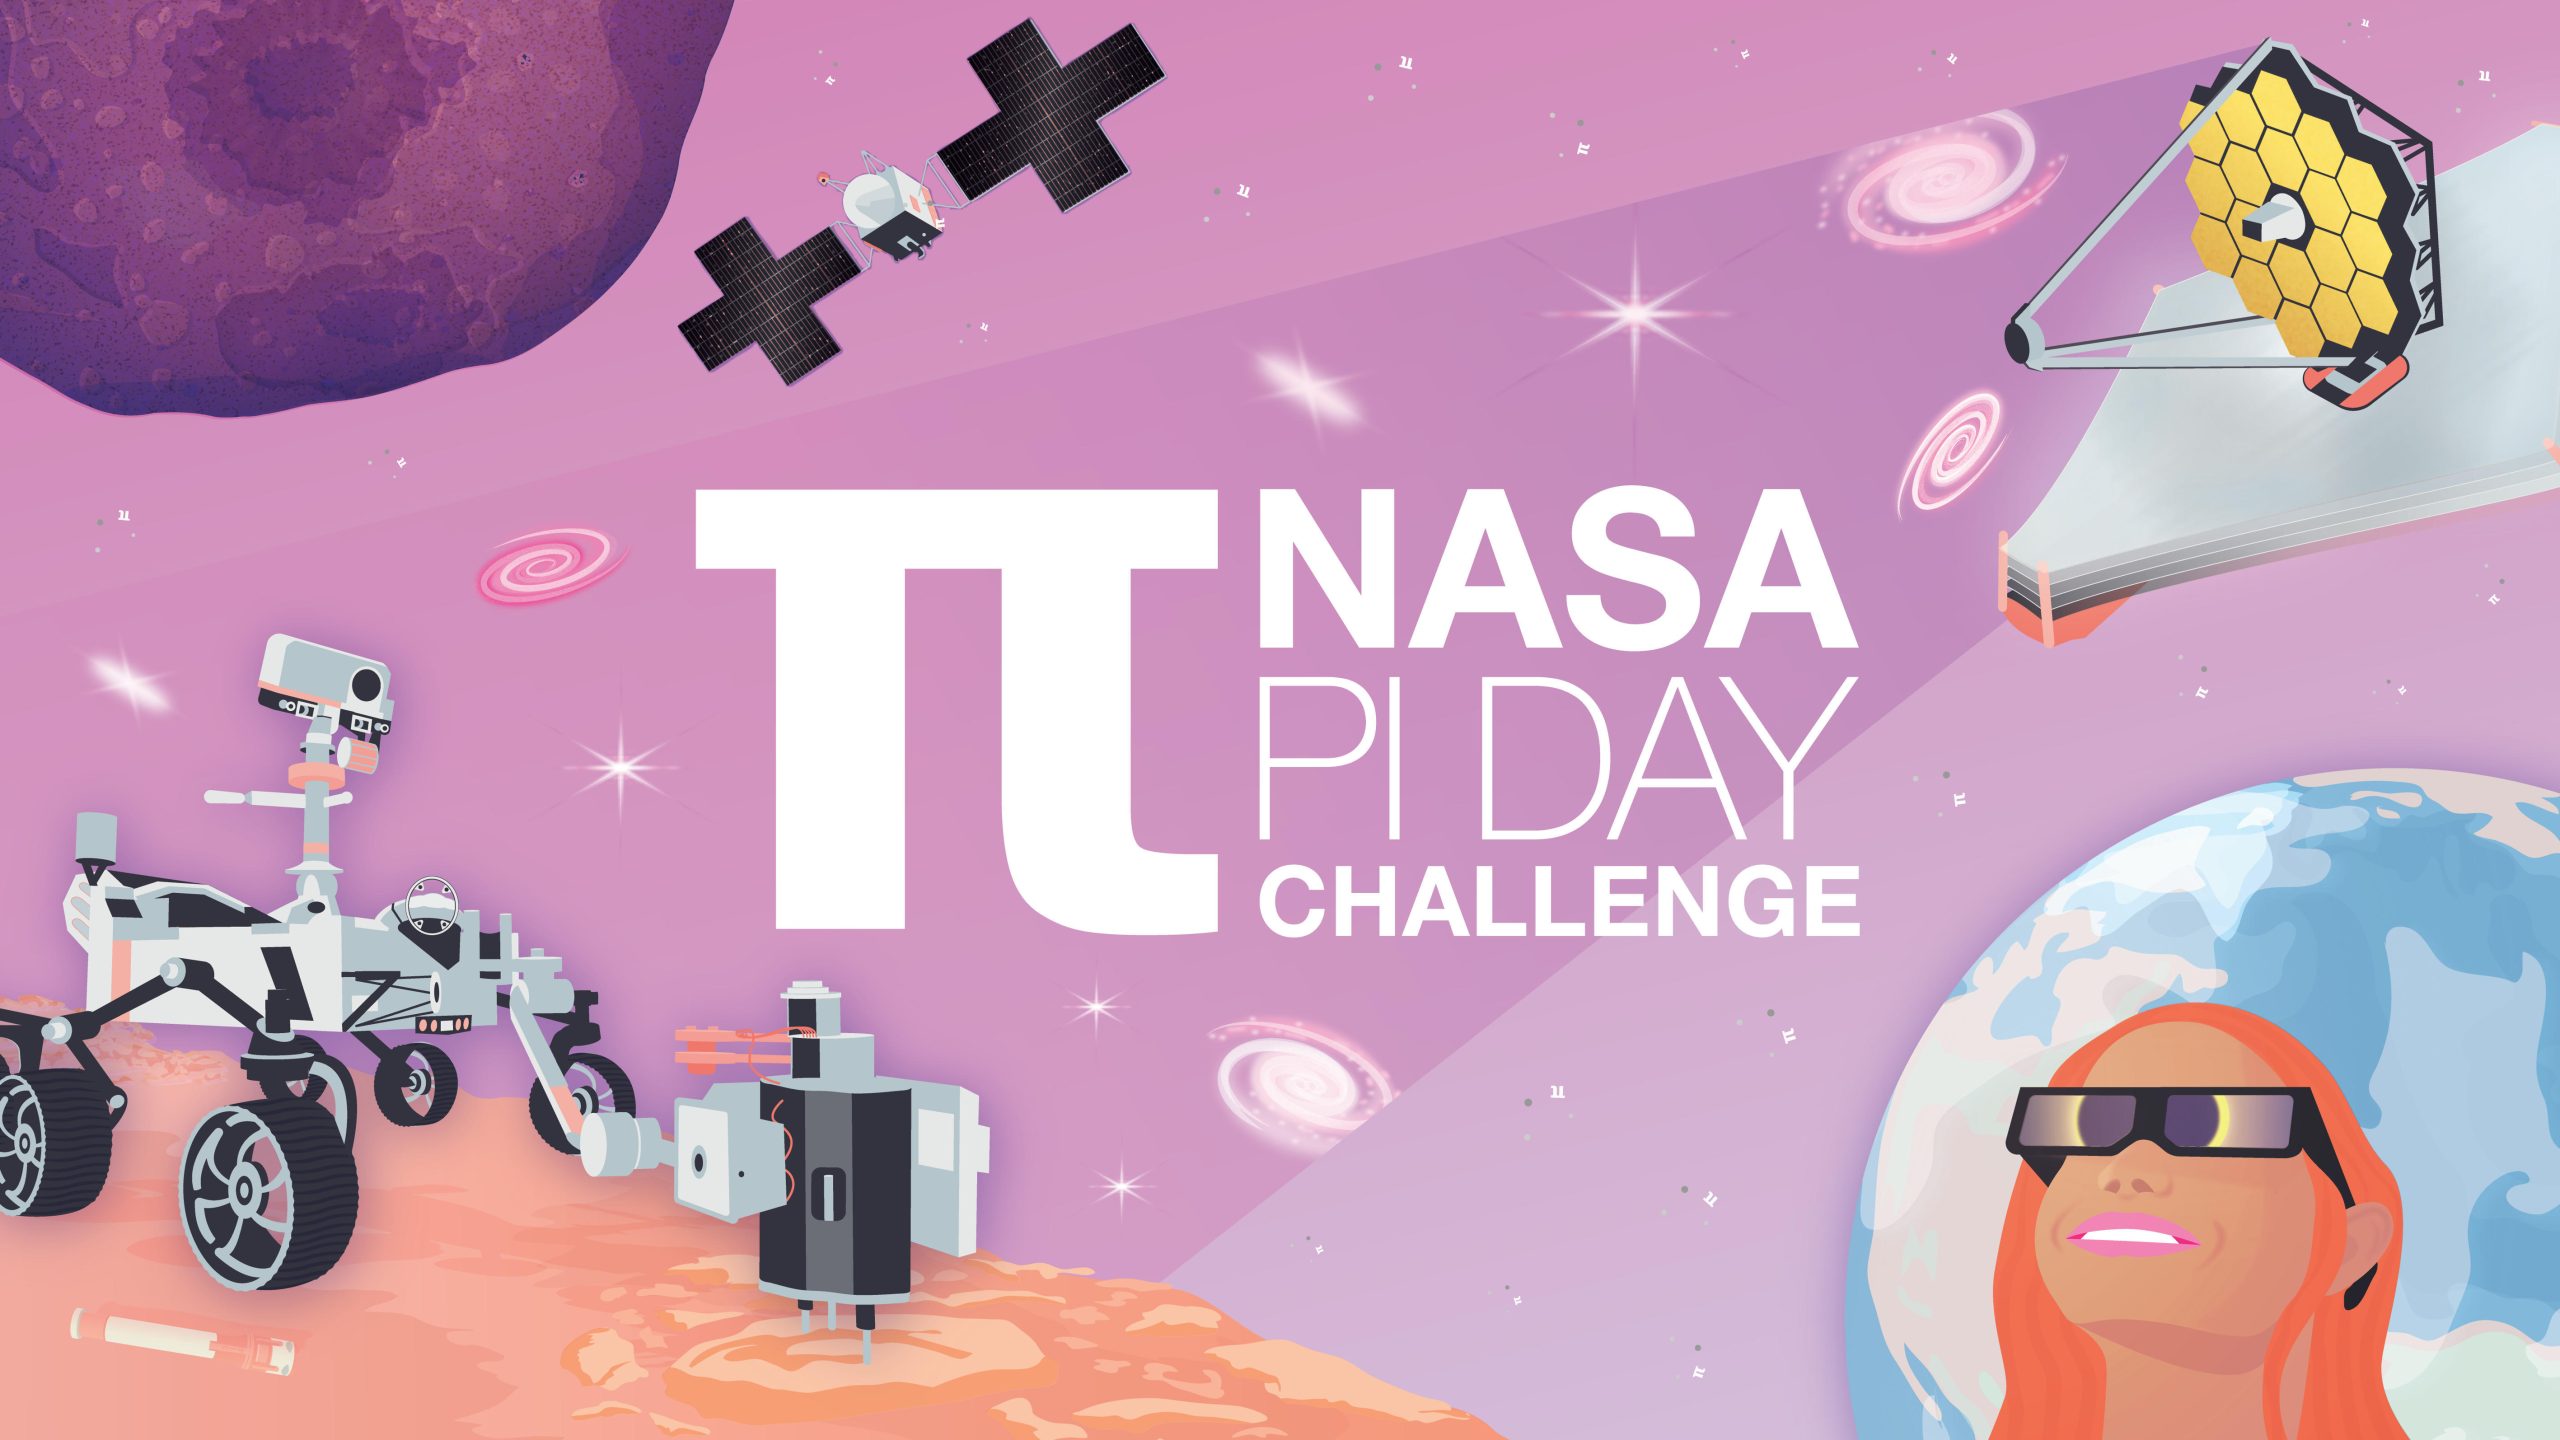
Can you use π (pi) to solve these stellar math problems faced by NASA scientists and engineers?
You may already know all about the mathematical constant pi (π) and how it can be used to calculate things like the circumference of a circle or the volume of a sphere. But did you know pi is also used all the time by NASA scientists and engineers to explore other planets? In this challenge, you can solve some of the same problems NASA scientists and engineers do using pi!
If you need some pi formulas here are the ones you might want to look at.
Read the full article at: www.jpl.nasa.gov

After months of anticipation, OpenAI has released a powerful new image- and text-understanding AI model, GPT-4, that the company calls “the latest milestone in its effort in scaling up deep learning.”
GPT-4 is available today via OpenAI’s API with a waitlist and in ChatGPT Plus, OpenAI’s premium plan for ChatGPT, its viral AI-powered chatbot.
Read the full article at: techcrunch.com

ChatGPT 4 is coming, and rumors suggest massive improvements in the GPT-4 model, surpassing Bing Chat, but OpenAI warns we might be disappointed.
Read the full article at: www.digitaltrends.com

Fast Company’s 2023 ranking of the World’s Most Innovative Companies features OpenAI at No.1, and covers 54 industries, from advertising, beauty, and retail to enterprise technology, design, and social impact.
Most Innovative Companies 2023, Fast Company’s definitive chronicle of the novel ideas transforming business and society, was 100% produced by people.
We may have asked ChatGPT—the AI chatbot created by our No. 1 company, OpenAI—about certain companies, but only because we wanted to see how it would reply. A very human impulse! OpenAI is just one example of how advances in artificial intelligence are reimagining corporate America, from drug discovery (DeepMind) to office work (Canva) to security (Robust Intelligence). But our ranking of the World’s 50 Most Innovative Companies—and the 54 lists that chronicle the 10 most innovative organizations in sectors from advertising to the workplace—showcase inspiring, insightful stories well beyond the current hot thing.
Healthcare is being made more equitable—for transgender individuals (Folx Health), women (Maven Clinic), children (Hazel Health), and lower-income patients (Cityblock Health)—by companies that are tailoring their offerings to communities that have traditionally been poorly served.
Iconic brands are changing how they communicate with fans, giving more power to creators and connecting with the culture (McDonald’s, Tiffany & Co.), while the entire world of restaurants and consumer packaged goods is being remade with content at its core (MrBeast).
On Earth, the soil is being fortified (Regrow Ag), the victims of climate disasters can now get a mobile grid to weather the disruption (Sesame Solar), and one of the world’s most influential brands, Patagonia, has made the planet its sole shareholder (Holdfast Collective).
Meanwhile, in space, public and private entities alike (NASA, Axiom Space) are advancing what’s possible in orbit.
Finally, there’s the art collective (Mschf) commenting on consumer and business culture with a knowing wink.
We hope you find these winners as inspiring as we did while selecting them.
Read the full article at: www.fastcompany.com
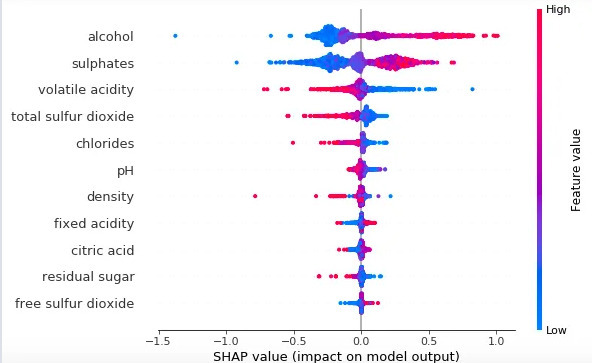
Intuitive explanations of the most popular machine learning models and algorithms of 2023.
Read the full article at: medium.com
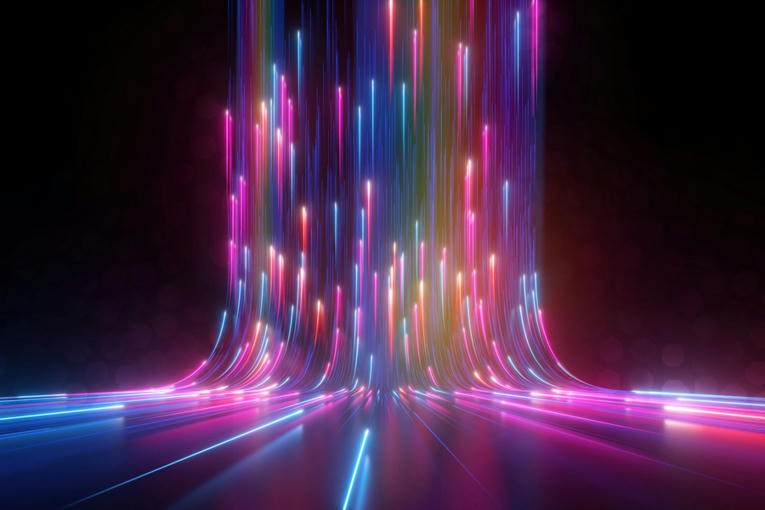
A new technique greatly reduces the error in an optical neural network, which uses light to process data instead of electrical signals. With their technique, the larger an optical neural network becomes, the lower the error in its computations. This could enable them to scale these devices up so they would be large enough for commercial uses.
As machine-learning models become larger and more complex, they require faster and more energy-efficient hardware to perform computations. Conventional digital computers are struggling to keep up.
An analog optical neural network could perform the same tasks as a digital one, such as image classification or speech recognition, but because computations are performed using light instead of electrical signals, optical neural networks can run many times faster while consuming less energy.
However, these analog devices are prone to hardware errors that can make computations less precise. Microscopic imperfections in hardware components are one cause of these errors. In an optical neural network that has many connected components, errors can quickly accumulate.
Even with error-correction techniques, due to fundamental properties of the devices that make up an optical neural network, some amount of error is unavoidable. A network that is large enough to be implemented in the real world would be far too imprecise to be effective.
MIT researchers have overcome this hurdle and found a way to effectively scale an optical neural network. By adding a tiny hardware component to the optical switches that form the network’s architecture, they can reduce even the uncorrectable errors that would otherwise accumulate in the device.
Their work could enable a super-fast, energy-efficient, analog neural network that can function with the same accuracy as a digital one. With this technique, as an optical circuit becomes larger, the amount of error in its computations actually decreases.
“This is remarkable, as it runs counter to the intuition of analog systems, where larger circuits are supposed to have higher errors, so that errors set a limit on scalability. This present paper allows us to address the scalability question of these systems with an unambiguous ‘yes,’” says lead author Ryan Hamerly, a visiting scientist in the MIT Research Laboratory for Electronics (RLE) and Quantum Photonics Laboratory and senior scientist at NTT Research.
Hamerly’s co-authors are graduate student Saumil Bandyopadhyay and senior author Dirk Englund, an associate professor in the MIT Department of Electrical Engineering and Computer Science (EECS), leader of the Quantum Photonics Laboratory, and member of the RLE. The research is published today in Nature Communications.
Read the full article at: news.mit.edu
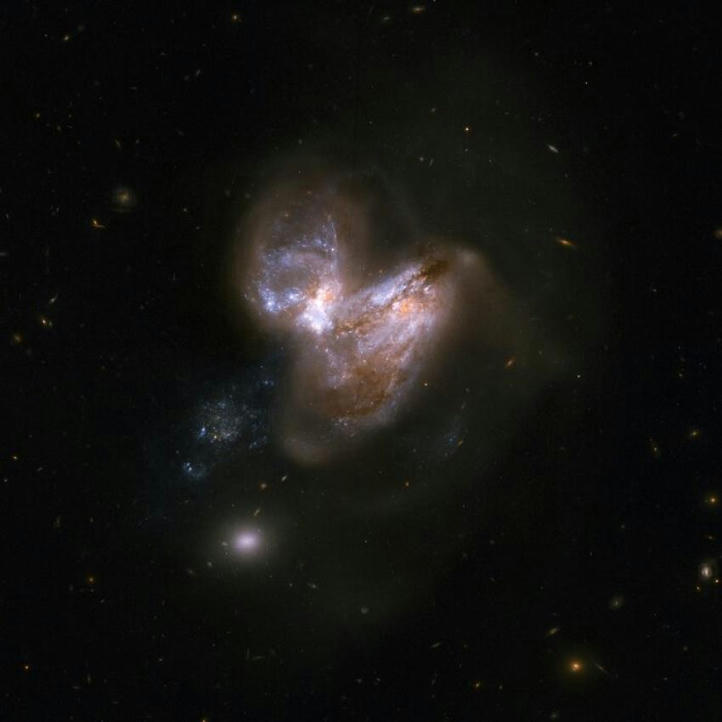
Astronomers from the University of Texas and the University of Arizona have discovered a rapidly growing black hole in one of the most extreme galaxies known in the very early Universe. The discovery of the galaxy and the black hole at its centre provides new clues on the formation of the very first supermassive black holes. The new work is published in Monthly Notices of the Royal Astronomical Society.
Using observations taken with the Atacama Large Millimeter Array (ALMA), a radio observatory sited in Chile, the team have determined that the galaxy, named COS-87259, containing this new supermassive black hole is very extreme, forming stars at a rate 1000 times that of our own Milky Way and containing over a billion solar masses worth of interstellar dust. The galaxy shines bright from both this intense burst of star formation and the growing supermassive black hole at its center.
The black hole is considered to be a new type of primordial black hole — one heavily enshrouded by cosmic “dust,” causing nearly all of its light to be emitted in the mid-infrared range of the electromagnetic spectrum. The researchers have also found that this growing supermassive black hole (frequently referred to as an active galactic nucleus) is generating a strong jet of material moving at near light speed through the host galaxy.
Today, black holes with masses millions to billions of times greater than that of our own Sun sit at the centre of nearly every galaxy. How these supermassive black holes first formed remains a mystery for scientists, particularly because several of these objects have been found when the Universe was very young. Because the light from these sources takes so long to reach us, we see them as they existed in the past; in this case, just 750 million years after the Big Bang, which is approximately 5% of the current age of the Universe.
What is particularly astonishing about this new object is that it was identified over a relatively small patch of the sky typically used to detect similar objects — less than 10 times the size of the full moon — suggesting there could be thousands of similar sources in the very early Universe. This was completely unexpected from previous data.
The only other class of supermassive black holes we knew about in the very early Universe are quasars, which are active black holes that are relatively unobscured by cosmic dust. These quasars are extremely rare at distances similar to COS-87259, with only a few tens located over the full sky. The surprising discovery of COS-87259 and its black hole raises several questions about the abundance of very early supermassive black holes, as well as the types of galaxies in which they typically form.
Ryan Endsley, the lead author of the paper and now a Postdoctoral Fellow at The University of Texas at Austin, says “These results suggest that very early supermassive black holes were often heavily obscured by dust, perhaps as a consequence of the intense star formation activity in their host galaxies. This is something others have been predicting for a few years now, and it’s really nice to see the first direct observational evidence supporting this scenario.”
Read the full article at: ras.ac.uk